By Steve Voynick
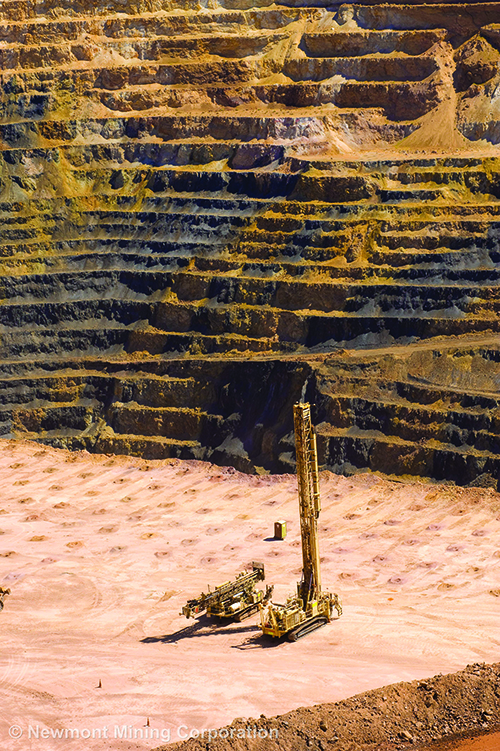
Among the many effects of the COVID-19 pandemic on the global economy is an adverse impact on the mine-supply side of the gold market. The pandemic has already curtailed gold exploration and gold-mine-development activities, as well as the production of existing gold mines—all factors to consider from the bigger perspective of “peak gold.”
“Peak gold,” a term that has been bandied about for decades, is again on the minds of metal-market analysts, economists, and metal investors. Many believe that peak gold—now predicted to occur in 2024—will send the metal on its way to $10,000 per troy ounce or higher and open the door to the best gold-related investment opportunity since the 1970s. Peak gold refers to the year when the annual world gold-mine production is maximized and will never again achieve that level. It marks the time when the gold supply begins to fall rapidly short of demand, and gold prices take off.
Origins of “Peak Gold”
(STEVE VOYNICK)
The concept of peak gold is a spin-off of Hubbert’s Peak Theory, which states that the production of nonrenewable resources follows a bell-shaped curve by climbing, peaking, and then going into terminal decline. Developed in the 1950s by the American geophysicist and geologist M. King Hubbert to predict petroleum production, this theory has since been applied to another nonrenewable resource—gold.
Since gold became a free-market commodity in the 1970s, demand for the metal has increased steadily. The only reason that gold prices have not gone through the roof is that mine production has been able to keep pace. But any sustained decrease in mine output will disrupt this rather precarious supply-demand relationship, which is the reason the forecast of peak gold should be of concern to everyone involved in mining, buying, or selling the metal.
A line graph representing the last 50 years of annual gold production forms half of a bell-shaped curve. The steep “front” of this curve shows how production had accelerated rapidly since 1980. But during the past few years, production has leveled and now appears to be at the peak of this incomplete curve. If the Hubbert theory is correct, the beginning of the downturn that will form the backside of the curve is imminent. In other words, the peak gold period is nearing, and gold-mine production will begin its terminal decline.
Tracking Influence of Gold Prices
While a simple line graph can represent gold-mine production, the chart is shaped in part by a sophisticated and interrelated scenario of gold prices, gold discoveries, ore grades, extraction technology, and mine-operating costs. Before discussing these factors, let’s review a few basic terms. The price and weight of gold are expressed in a somewhat confusing mix of traditional troy ounces and the metric units of grams, kilograms, and tonnes. One troy ounce contains 31.103 grams. A tonne (metric ton) contains 1,000 kilograms or 32,150.7 troy ounces.
The grade of gold ore refers to the weight of the gold present in a given amount of mineralized rock. Traditionally expressed in troy ounces per ton, gold-ore grades are now stated in grams per tonne. A grade of 31.0 grams per tonne roughly equals 1.0 troy ounce per ton; 0.1 gram per tonne equates to 0.032 troy ounces per ton.
What the mining industry calls “gold in the ground” is classified either as “ore” (also called “reserves”) or as “resources.” Ore definition is the mineralization of sufficient grade that can be profitably mined today. Because mining costs vary with location, depth, mineralization chemistry, and methods of mining, ore classification is site-specific. What is ore at one mine is not necessarily ore at another.
Resources are mineralized deposits that are too low in grade to be mined profitably today, but which may, given higher gold prices and advanced recovery technologies, be worth mining in the future. Lower gold prices, of course, can also downgrade ores to resources. In mining-company financial statements, assets depend heavily on whether mineralization is classified as ore or resources.
Gold-Production Trends
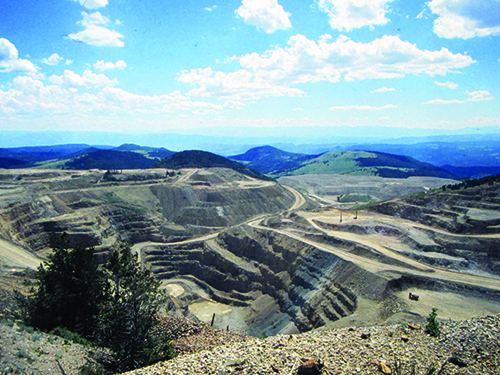
Despite many short-term ups and downs, the historical, long-term
(STEVE VOYNICK)
gold-production trend has always been upward. Peak gold has been predicted three times in the past—in 1970, 2001, and 2015. But it failed to materialize each time, and annual gold production currently stands at an all-time high of 3,409 tonnes (nearly 110 million troy ounces).
This previous inability to predict peak gold shows that Hubbert’s Peak Theory, as applied to gold, is vulnerable to unexpected economic, technological, and production factors. And these explain why previous predictions failed—and why the 2024 forecast for peak gold may be correct. Before 1900, most gold ores graded at least 31 grams per tonne or, as the old-time miners would say, “an ounce a ton.” But by the 1950s, this average had dropped to 12 grams per tonne. Today, it is a mere 1.0 gram per tonne. This substantial decline in grade reflects both the depletion of most high-grade deposits and the technological ability to extract gold profitably from very low-grade ores.
Ore grades do not translate directly into gold yield. Inefficiencies in extraction technologies limit today’s average gold-recovery rate to only 72 percent. Ore grading 1.0 gram per tonne thus yields only 0.72 grams of gold. Actual recovery rates range anywhere from 50 to 85 percent depending upon ore chemistry and each mine’s approach to gold recovery. The most costly methods maximize gold recovery; others are more economical but offer less recovery efficiency.
In 1906, South Africa assumed the lead in world gold production, a position it would hold for the next century. The rich ores in South Africa’s Witwatersrand Basin often grade more than 100 grams per tonne—but their great depth makes for very high mining costs.
By the 1960s, gold mining was stagnating in every nation, except for South Africa. With gold fixed at an underpriced $35 per troy ounce and inflation rapidly driving mining costs upward, many deposits were simply not worth mining.
Gold Mining Sources
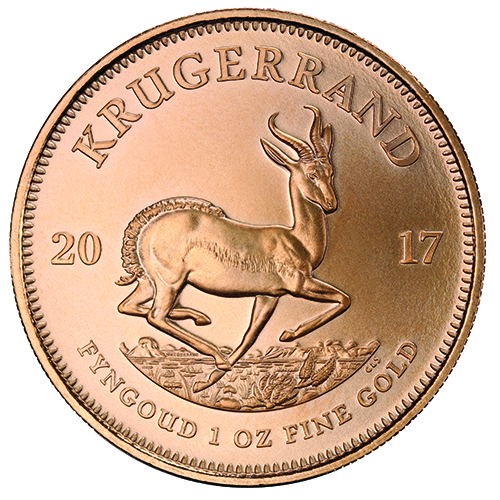
In the United States, two-thirds of all newly mined gold came not from gold mines, but as a by-product of base-metal mining. At that time, South Africa alone accounted for 70 percent of world gold production. To help market its massive output of gold, South Africa introduced the one-troy-ounce Krugerrand, the first modern gold bullion coin available for private investment.
South Africa hit its all-time annual record production of 1,518 tonnes of gold in 1970. But by then, the soaring costs of ever-deeper mining had begun slowing production—and that brought the first prediction of peak gold, which initially seemed right on the money. By 1975, dragged down by South Africa’s declining output, annual world production had sagged to a mere 800 tonnes. But the 1970s also brought sweeping economic and technological transitions. First, gold emerged as an unrestricted commodity on a free market of supply and demand. Its price hit $200 per troy ounce in 1979, spiked to a record $850 in 1980, then settled into the $300-400 range.
The second transition came with advances in cyanidation, a process introduced in 1890 that uses dilute cyanide solutions to dissolve gold from crushed ores. Cyanidation had enormous potential, but recovering the gold from cyanide solutions was costly and difficult. Finally, in the 1950s, researchers developed the carbon-in-pulp (CIP) process that made possible the economic recovery of gold from very-low-grade ores. This process was successfully tested on a commercial scale in Nevada during the 1970s.
By then, geologists had found many large, shallow, very-low-grade gold deposits. Often grading only one gram per tonne or less, these were classified not as ores, but as resources. But now, with higher gold prices and an efficient recovery process, these resources suddenly became ores that could be mass-mined from open pits, coarsely crushed, dumped into massive heaps, and leached with cyanide. CIP could then inexpensively recover the gold from the cyanide solutions.
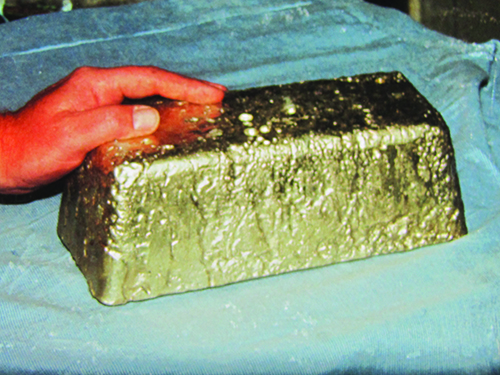
Gold-Mining Revolution
(STEVE VOYNICK)
The economic restructuring and technological advances of the 1970s revolutionized the gold-mining industry, negated the idea that peak gold had been achieved in 1970, and led to the greatest gold-mining boom ever. World production soared to 2,000 tonnes in 1990, then hit 2,600 tonnes in 2001. But by 2008, production had sagged to 2,300 tonnes. Looking in the rearview mirror, many analysts confidently announced that peak gold had, in fact, been achieved in 2001 and that production would continue to go downhill.
But they were wrong. Instead, production picked up and by 2011 was setting new records. This time the peak-gold prediction was upset by the delayed payoff of earlier exploration. During the 1980s and 1990s, mining companies had invested heavily in exploration and found numerous very-low-grade gold deposits.
Miners measure gold discoveries in troy ounces. And the last two decades of the 20th century each saw at least one 50-million-troy-ounce discovery, along with at least ten of 30 million troy ounces, and many of 10 million troy ounces. The rate of discovery declined rapidly after 1995.
Because about 15 years are needed to transform discovery into a producing gold mine, a host of new mines belatedly came on line around 2010. Their collective output debunked the idea that peak gold was met in 2001. Peak gold was again predicted for 2015 when annual production topped 3,100 tonnes. This time analysts argued convincingly that the discoveries of the 1990s had all been brought to production and that few new deposits had since been found. But once again, peak gold was not to be. Production flattened briefly, then set consecutive records in 2017, 2018, and 2019, thanks to the unexpected emergence of a new major gold producer—China.
Unexpected Gold Sources
Historically, China had never been a prolific source of gold. But in 1976, the Chinese government implemented a program to accelerate economic growth, one step of which called for the rapid development of mineral resources. As exploration programs found new deposits, old mines expanded, and many new, small mines opened.
In 1980, China produced only 2.5 tonnes of gold. But by 1990, the collective output of nearly 1,000 small mines had boosted annual production to 90 tonnes. During the next 15 years, China modernized its gold-mining industry, closed or consolidated its small, technologically obsolete mines, and developed modern open pits. The results were beyond all expectations. In 2006, China turned out 236 tonnes of gold to take the lead in world production. Then, just as peak gold had been predicted for 2015, China’s annual production jumped to 400 tonnes, a level it has since maintained.
Many analysts are now forecasting peak gold for 2024—and this time, their prediction seems better grounded. First, the economic restructuring and technological innovation that rescued the gold-mining industry in the 1970s will not be present. Gold is a firmly established free-market commodity, and no significant new technological innovations will again revolutionize the industry.
Second, although annual gold production has risen in each of the past 12 years, the rate of new gold discoveries has been flat for more than 20 years. Due to low exploration-investment return, current exploration funding is only half that of the 1990s. CFRA Research gold analyst Matthew Miller agrees with geologists, saying, “The largest and most prolific reserves have been found.” In 2019, President and CEO of Alamo Gold John McClusky summed up the bleak prospect for significant discoveries with: “All the low-hanging fruit has been picked.”
Transition of Old and New Mines
Older mines scheduled to close in the near future outnumber the new
(STEVE VOYNICK)
mines coming online. Addressing the prospects of operating mines, Bruce McCloud, president, and CEO of Sabina Gold & Silver Corp., recently said, “There are very few companies that can maintain current gold production five or ten years out.”
Third, no new “China” is about to emerge as an unexpected major gold source, while China’s production is expected to decline slowly. Among the other leading gold-producing nations, the output of Australia, Russia, and the United States is projected to decrease or, at best, remain flat. It is anticipated, only Canada will increase its gold production over the next five years significantly.
Fourth, ore grades will continue to decline, which drives mining costs upward. While today’s average ore grade is 1.0 gram per tonne, the average grade of the few mines now under development is only 0.66 grams per tonne. Some low-cost open pits are already exploiting ores grading just 0.4 grams per tonne (only 0.012 troy ounces per tonne). Based on a 70-percent-recovery efficiency, about 100 tonnes of this ore must be mined and processed to recover a single troy ounce of gold.
Another problem is refractory ores with problematic chemistries. Many deposits of shallow, readily leached, oxidized ores are already depleted; remaining deposits often consist of cyanidation-resistant sulfide ores that are more costly to process.
Gold production figures, as provided by the World Gold Council and the United States Geological Survey, are not precise. The lack of decisive data is due mainly to the uncertain output of the informal artisanal-mining sector, which consists of millions of unregulated, usually illegal, and undocumented miners who work in Africa, South America, and parts of Asia. Many people in undeveloped regions have but one alternative to abject poverty—using primitive tools and manual labor to coax small amounts of gold from previously worked surface deposits. They are motivated by the fact that a single gram of gold, minus impurity, and processing fees, can be worth more than $40—several times the weekly wage of unskilled laborers.
The Artisanal Gold Council, a Canada-based, international organization that monitors artisanal mining worldwide, estimates that 20 million artisanal gold miners in 70 nations are recovering more than 300 tonnes of gold each year. That accounts for nearly 10 percent of global production. The primary factor underlying the value of gold, apart from durability, portability, and beauty, is its great rarity. On average, the Earth’s crust contains just 0.004 grams of gold per tonne, making gold ten times rarer than platinum, 20 times more than silver, and several thousand times more than copper.
Assessing the Volume of Mined Gold
The United States Geological Survey estimates that 198,000 tonnes of gold have been mined throughout history. Surprisingly, all this gold would only fill a 71-foot-cube or two Olympic-sized swimming pools to a depth of nine feet. Even more surprising is the fact that nearly half of all this gold has been mined in just the last 40 years. Because of its high density, one tonne of gold occupies only a 15-inch cube, which, at its current price of $1,700 per troy ounce, would be worth roughly $54 million.
Because we do our best not to lose, destroy, or discard gold, only about 12 percent of all the gold ever mined—roughly 23,000 tonnes—has been lost, mainly in shipwrecks and destructive or non-recyclable uses. Of the approximately 174,000 tonnes accounted for, the World Gold Council estimates that 47.7 percent exists as jewelry, 21.1 percent as private investment bars and coins, and 17.1 percent as government bullion reserves. Another 14.1 percent exists in medical, electrical, scientific, and industrial forms. The world’s current ore reserves—the gold in the ground that is ready to be mined—contain about 54,000 tonnes of gold. At the current rate of mining, these reserves will last only 16 years.
Analysts, geologists, and mining executives agree that the best years of the modern gold-mining boom are over. The current record annual mine output of 3,409 tonnes places the line-graph trend of gold production at what appears to be the top of Hubbert’s bell curve at, or very near, peak gold—the point when production begins to decline, and gold supply falls increasingly short of demand.
If the current predictions for peak gold prove valid, 2024 will be a landmark year in the economic and mining history of gold—and what could be the most significant opportunity for gold investors since the 1970s. And it is very possible that the COVID-19 pandemic could accelerate the arrival of peak gold.
About the Contributor: Steve Voynick is a regular contributor and columnist of Rock & Gem, a mineral collector, former hardrock miner, and the author of guidebooks like Colorado Rockhounding and New Mexico Rockhounding.